Turning Data into Decisions: A Year of BI Partnership in Action
When businesses think of Business Intelligence (BI), they often picture a dashboard or a report. But true BI is not a one-time build, it is an ongoing process of shaping data into clarity, trust, and action.
Over the past year, our BI team at Vaarta Analytics has partnered with a high-growth SaaS company pioneering AI-powered translation and localization to do exactly that. Together, we have built more than 20 dashboards, managed over 30, refined existing ones, and optimized countless queries to ensure teams always have the insights they need.
The Evolution of BI: From Granular to Centralized
Phase 1: Getting the Data Straight
We started by delivering granular reports and dashboards that untangled complex datasets. This helped establish data accuracy as the foundation.
Phase 2: Expanding Across Teams
Next, we scaled upward. Different functions such as Customer Success, Operations, Finance, Sales, and Marketing received dashboards tailored to their workflows.
Phase 3: A Centralized Homepage
Finally, we brought everything together. A single, centralized BI homepage now acts as the source of truth for leadership and teams, aligning conversations and reducing hours of manual preparation.
Beyond Dashboards: Building Confidence in Data
Our job was not just to create dashboards, it was to ensure people trusted and used them. Over the past year we:
Refined existing dashboards so they stayed relevant and aligned with business goals.
Optimized queries to improve performance and accuracy.
Provided ad-hoc reports and data pulls when teams needed quick answers.
Educated stakeholders on how to navigate dashboards, interpret numbers, and use insights effectively.
This continuous support built long-term adoption and trust, turning BI into a shared language across the organization.
The Client’s Voice
The impact is best described by the client’s own words:
“This dashboard consolidates all of the source of truth data we use for customer QBRs with easy-to-use visualizations, saving us hours of time and enabling us to create impactful QBRs faster.” – Michelle S.
“We are in a great place with data because of your help.” – Ben M.
“Thank you for continuously setting a high bar for the BI team and demonstrating the power of data to the organization.” – Mason H.
“The executive dashboard saves me a ton of time in pulling that data.” – Mike M.
The Result
More than 20 dashboards built and 30+ managed across functions
Trusted, centralized source of truth for performance data
Significant time savings in QBR preparation and executive reporting
Increased adoption and trust in BI across teams
👉 At Vaarta Analytics, we see BI not as a deliverable but as a journey. Over the past year, this journey has helped our client move from scattered reports to a unified, trusted data ecosystem that continues to grow with their business needs.
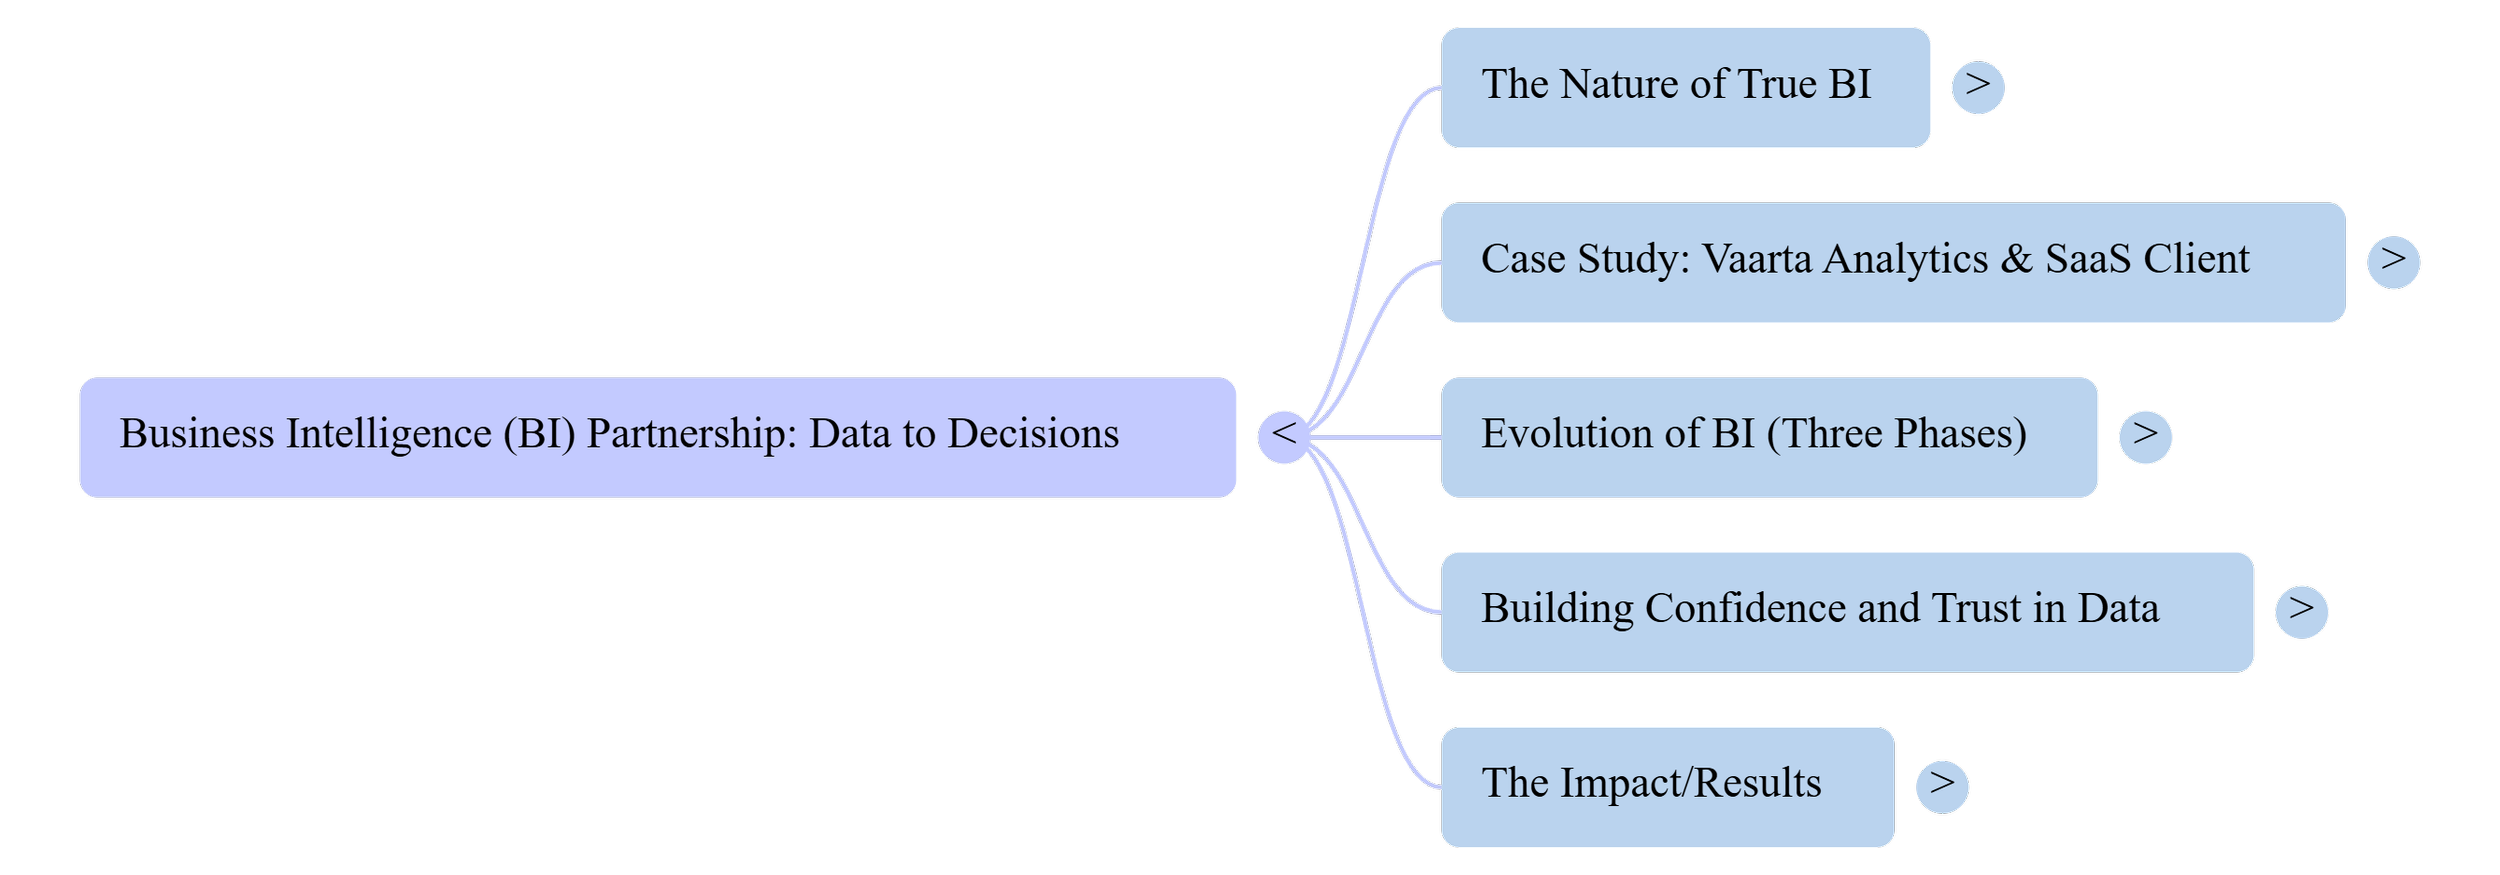
🧠 Visual Recap: Mind Map of This Article
A structured overview of everything we explored above — ideal for revisiting or sharing.
Why Teams Work with Vaarta Analytics
At Vaarta Analytics, we do not just provide analytics services. We act as a partner who builds what teams truly need.
From BI and Data Engineering to AI-powered systems and AI agents, our work is designed to remove bottlenecks, accelerate research, and
create space for innovation.
Whether you are an early-stage startup or a scaling enterprise, our tailored solutions help you:
Make smarter, faster decisions
Streamline complex workflows
Improve product launch readiness
Drive sustainable growth with data and automation